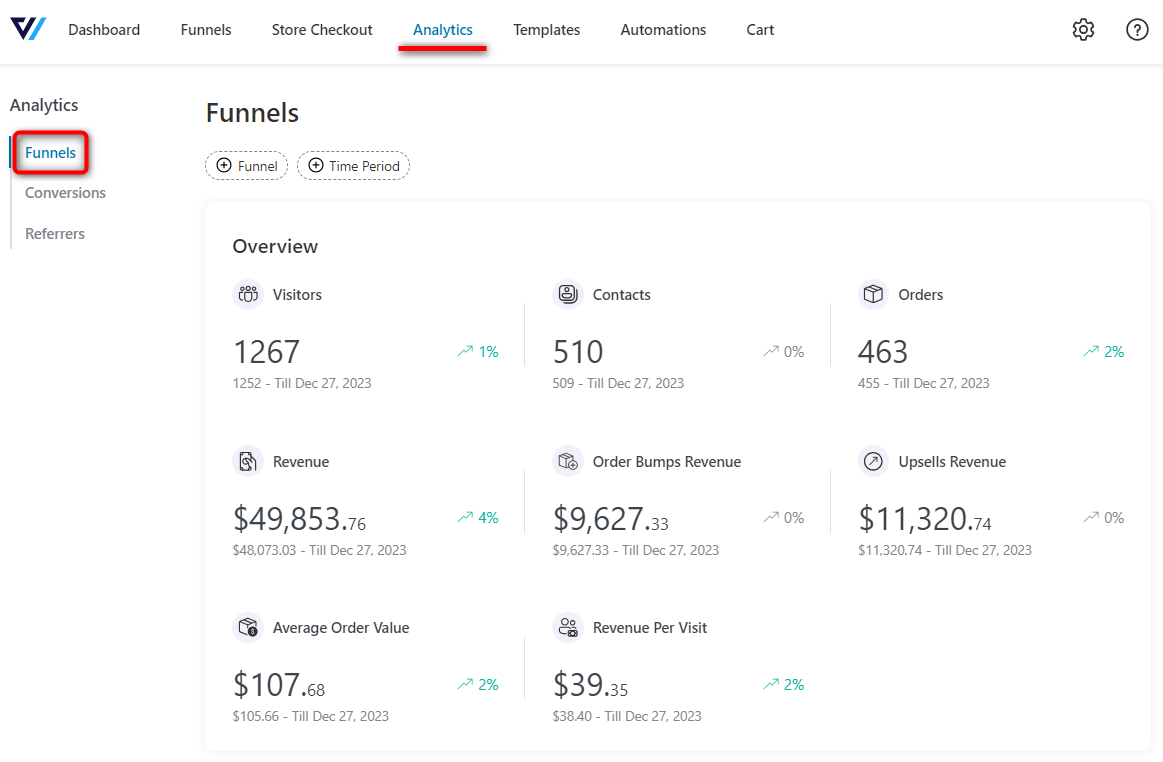
Track and measure the performance of your sales funnels in the Analytics tab.
Please note that this is the global analytics data of your complete WooCommerce store.
You can see the following information for your WooCommerce store:
- Visitors
- Contacts
- Orders
- Revenue
- Order Bumps Revenue
- Upsells Revenue
- Average Order Value
- Revenue Per Visit
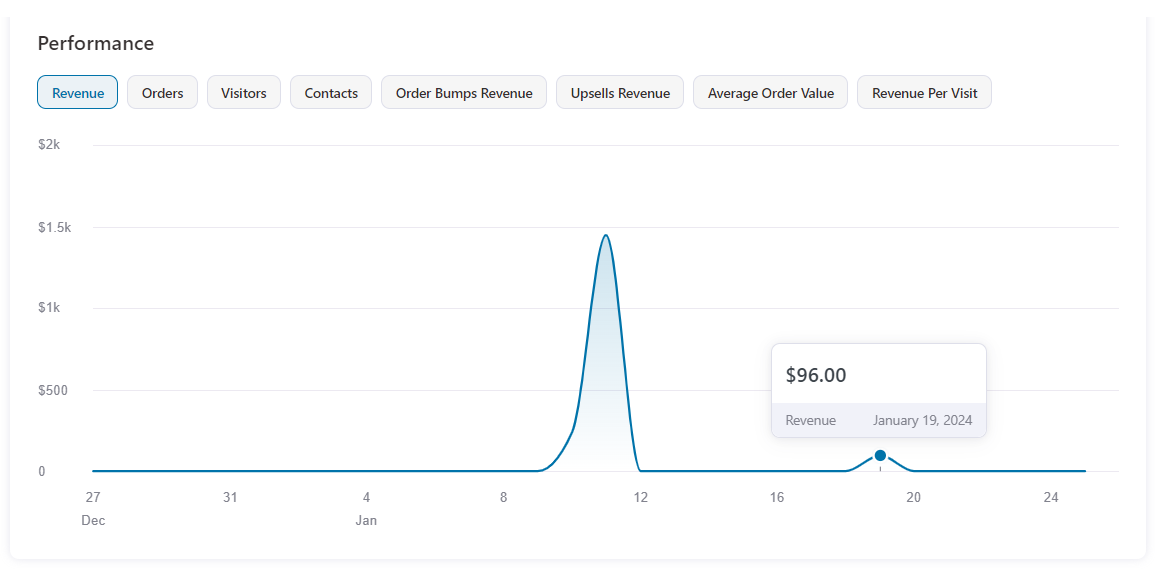
Performance Graph
View the analytics in conjunction with the stats plotted on the graph.
Select the data and see the performance graph for that metrics.
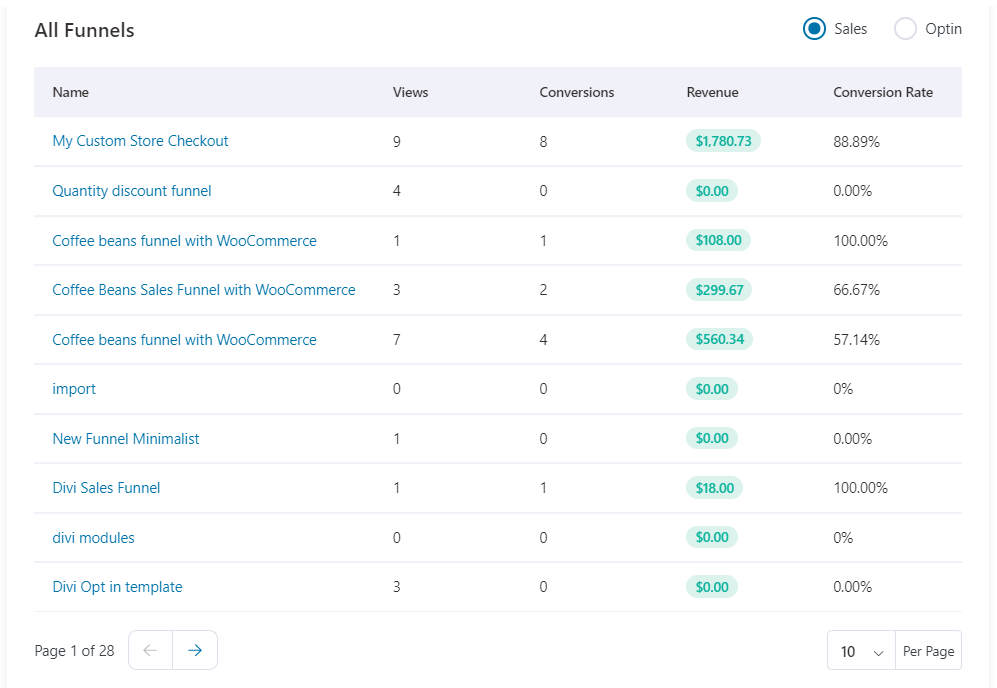
Conversions and Revenue Data for Latest Funnels
As you scroll down on the same page, you can view data for your recently created sales and opt-in funnels.
You can see stats like views, conversions, revenue, and conversion rate.
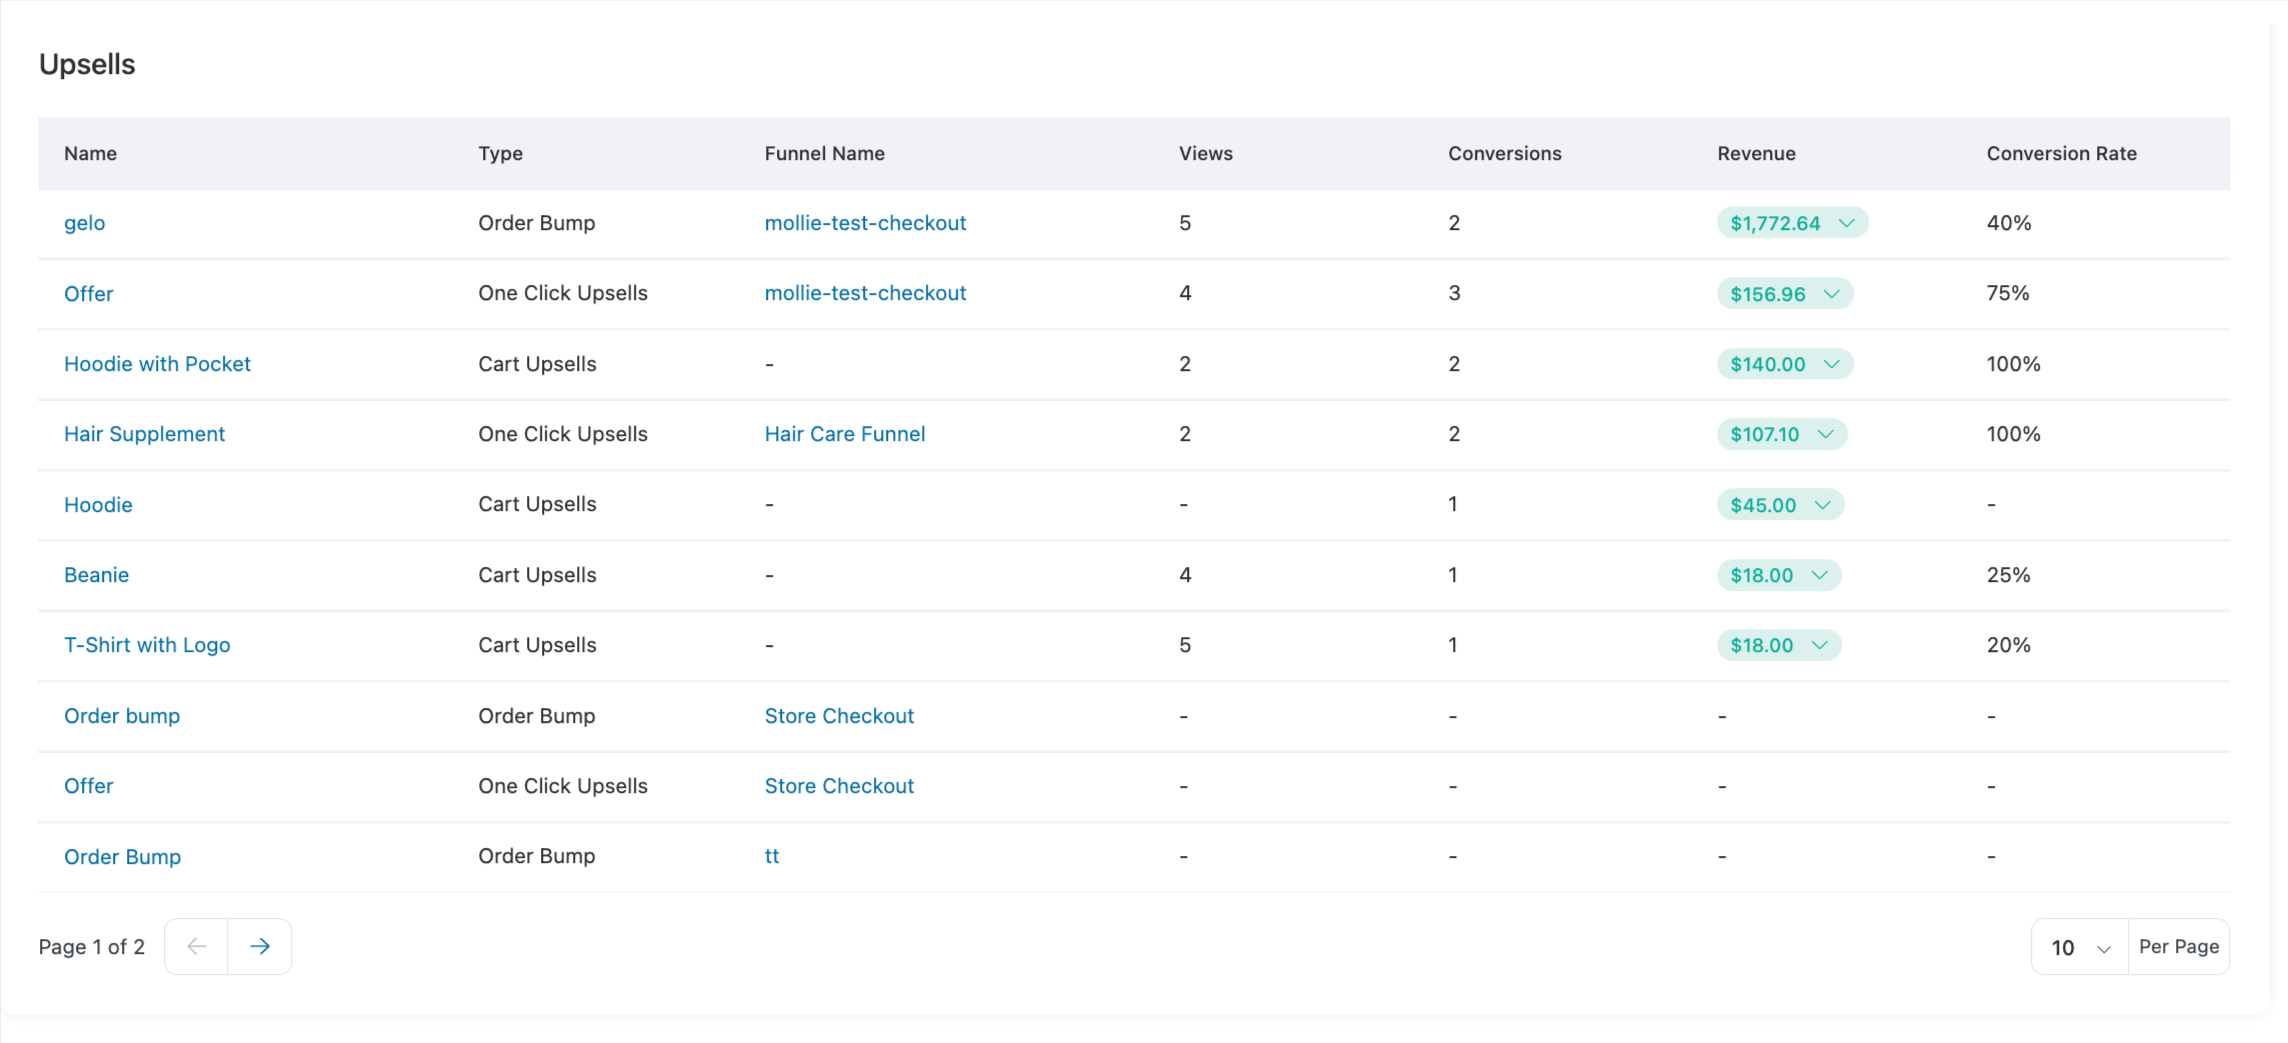
Upsells
Here you can find how order bumps and upsells are performing. For each offer, you can find the name, type, funnel name, views, conversions, revenue, and conversion rate.
Filter Funnel-Specific Data
If you want to see the stats from a specific funnel, you can filter the Funnel option or go to an individual funnel to see the analytics.
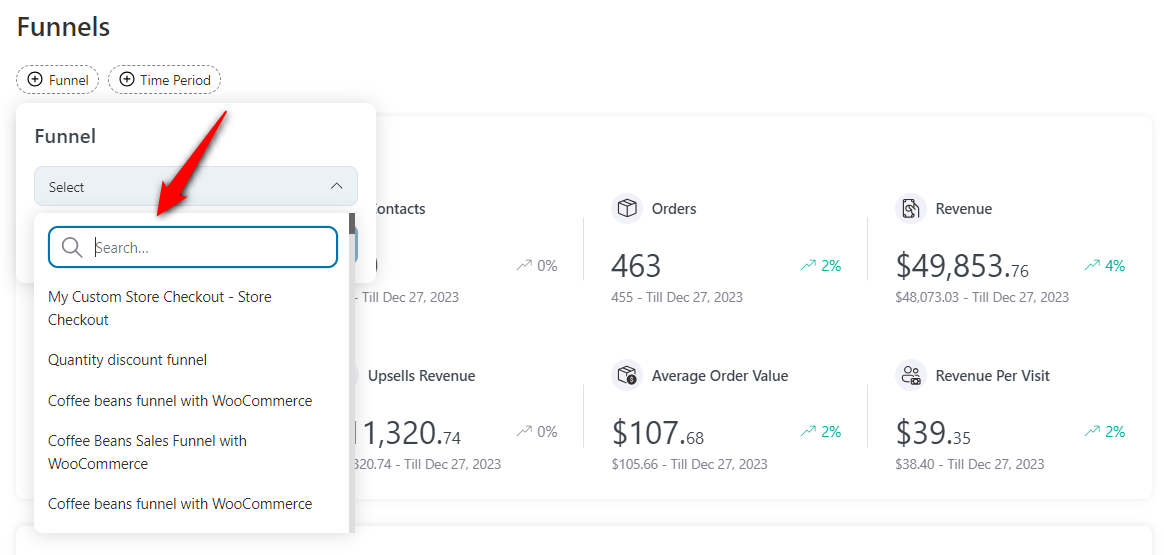
Select the funnel you want to see its data.
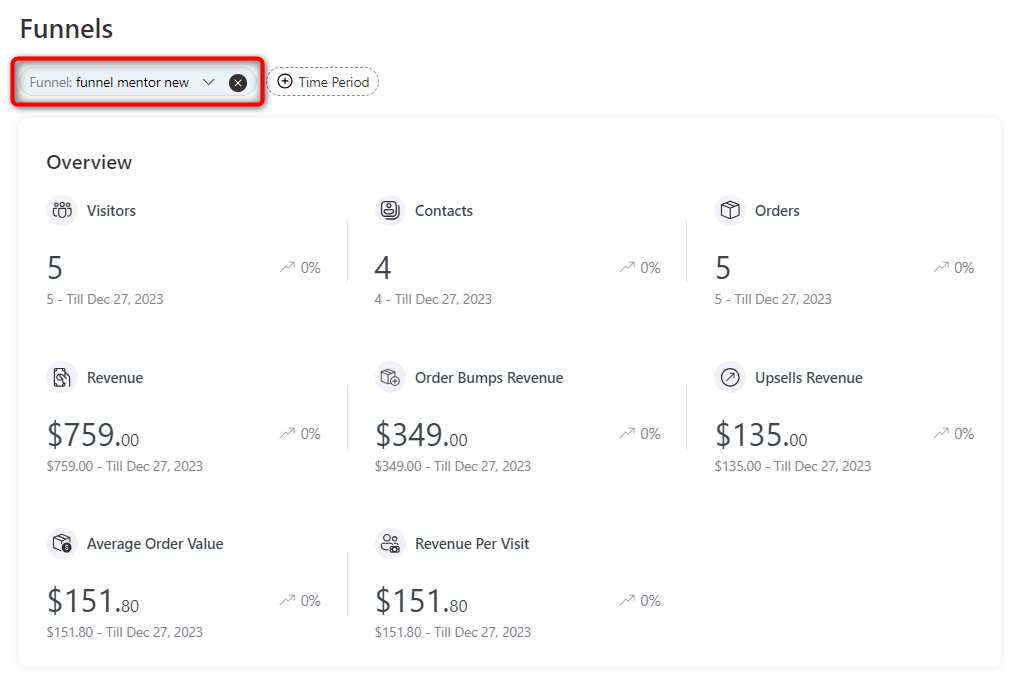
Scroll down and you'll be able to see the data for various components of your sales funnel:
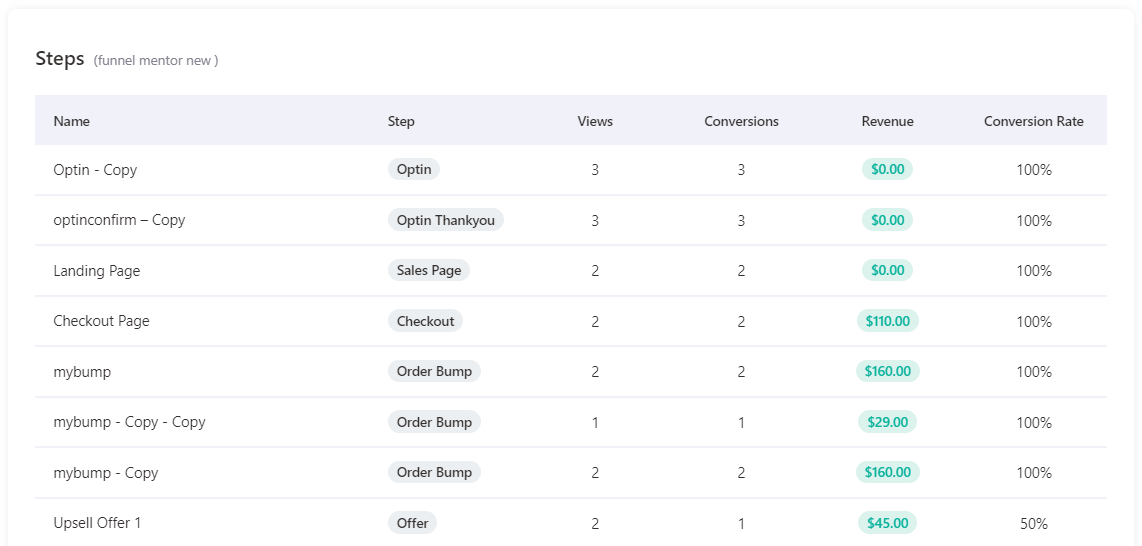
Here, you can see the number of views, conversions and revenue for each step.
Since the Optin, Sales and Thank you pages do not generate any revenue; therefore, it doesn’t have any stats there.
Rest, the Checkout, Order Bumps, and One-Click Upsells show the revenue.
Filter Data Specific to a Particular Date
Filter the date to see the performance of your store with respect to that time period.
You can even compare the stats and graphs to visualize how your funnel performance is moving with respect to a previous period.
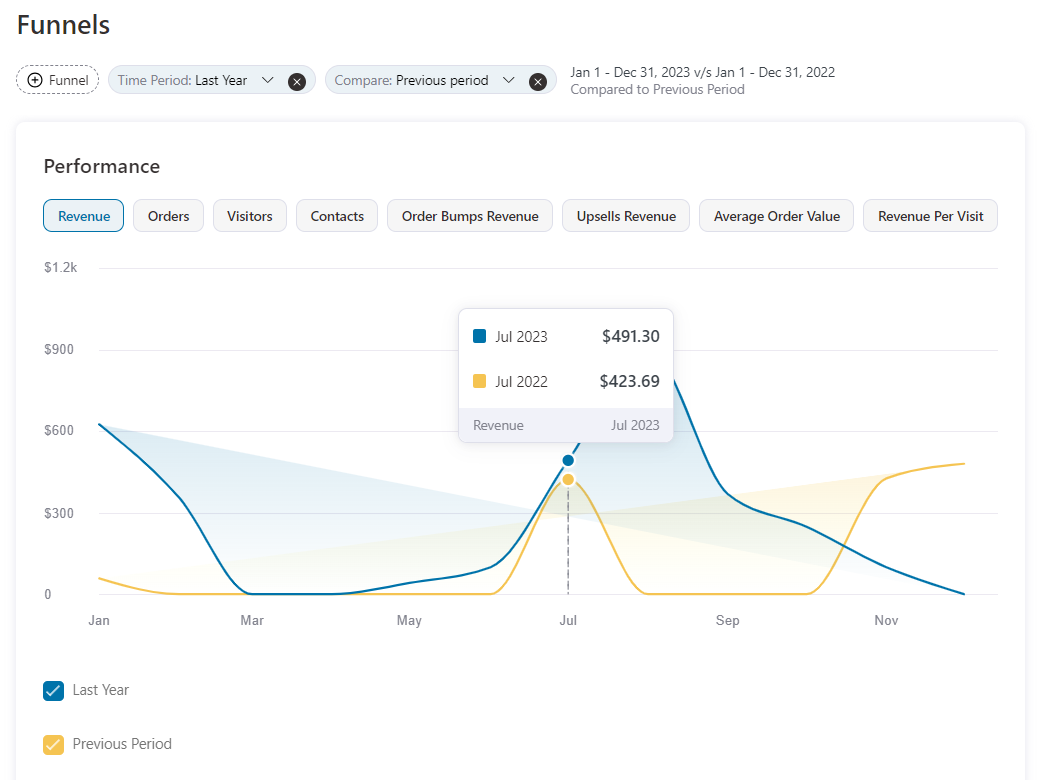
This helps you compare different data and find out improvements to boost your sales and conversions in your WooCommerce store.
This is all about the global funnel analytics you get in the FunnelKit Funnel Builder.
