Websites use several different Website coding languages to work. All websites use HTML, CSS, and JavaScript to render the webpage to the visitor.
When the website is loading but the website is not displaying correctly, this is usually due to a coding error on the site. Usually, this is caused by JavaScript or CSS errors. This documentation will focus on diagnosing JavaScript coding errors using the browser console window.
If any section on the Checkout is not working properly, you can diagnose them by using your browser's Error Console. Each browser has a built-in Error Console for diagnosing scripting errors on your site.
Below will show you how to check the Error Console in Firefox, Internet Explorer, Chrome, Edge, Safari, and Opera.
JavaScript Console for different browsers
For Firefox
We will find the JavaScript error using Firefox by following steps:
Step 1: Open the Console
Go to the screen where you are experiencing the error. In Firefox, navigate to Tools > Web Developer > Error Console or press Ctrl + Shift + J.
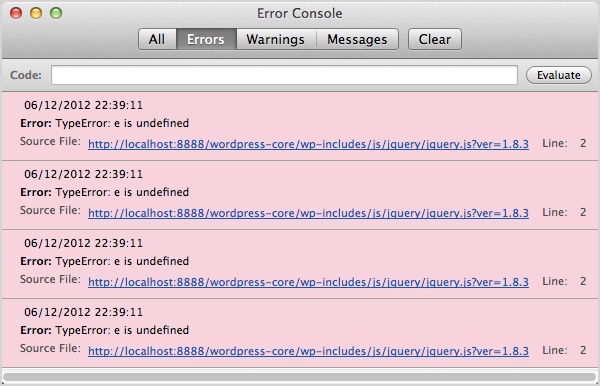
Step 2: Identify the Error
The error console will open. If you don't see any errors try reloading the page. The error may be generated when the page loads.
The console will provide you with the error type, the location of the error, and the line number.
For Internet Explorer (IE)

Keep in mind, IE behaves vastly differently from other browsers when it comes to JS errors, and reports on them in disparate ways. The first thing to check when facing a problem in IE is if the problem only exists in IE. Also note that the debugging tools built into some IE versions are limited, and may not be available.
We will find the JavaScript error using Internet Explorer by following steps:
Step 1: Open the Console
Go to the screen where you are experiencing the error. In Internet Explorer, navigate to Settings > F12 Developer Tools. Or click F12 and then click on the Console tab.

Step 2: Identify the Error
The error console will open. If you don't see any errors try reloading the page. The error may be generated when the page loads.
The console will provide you with the error type, the location of the error and the line number.
For Google Chrome
We will find the JavaScript error using Chrome by following steps:
Step 1: Open the Console
From the menu, select More tools > choose Developer tools or press Ctrl + Shift + J.

Step 2: Identify the Error
The error console will open. If you don't see any errors try reloading the page. The error may be generated when the page loads.
The console will provide you with the error type, the location of the error and the line number.
For Microsoft Edge
We will find the JavaScript error using Edge by following steps:
Step 1: Open the Console
From the menu, select Developer Tools > choose Console.

Step 2: Identify the Error
The error console will open. If you don't see any errors try reloading the page. The error may be generated when the page loads.
The console will provide you with the error type, the location of the error and the line number
For Safari
We will find the JavaScript error using Chrome by following steps:
Step 1. Enable Developer Tools
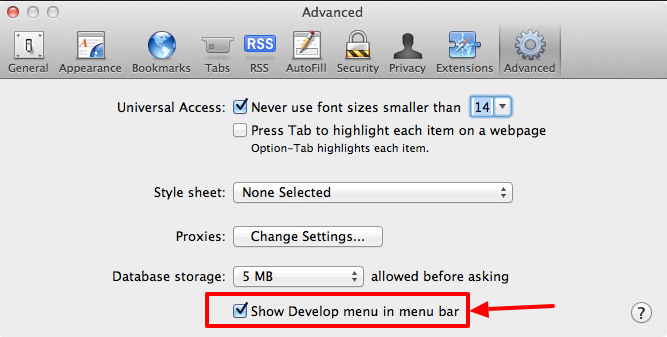
Navigate to Safari > Preferences > Advanced in the main menu and check Enable Show Develop menu in menu bar.
Step 2: Open the Console
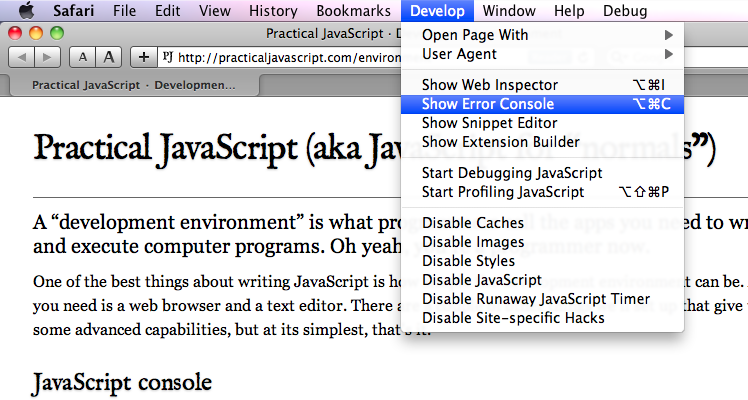
When the new option Develop appears in the menu:
Choose Show Error Console
Step 3: Identify the Error
The error console will open. If you don't see any errors try reloading the page.
The console shows you the error, the error location, and the line number:

For Opera
We will find the JavaScript error using Opera by following steps:
Step 1: Open the Console
From the menu, select Developer > Developer tools and select Console.
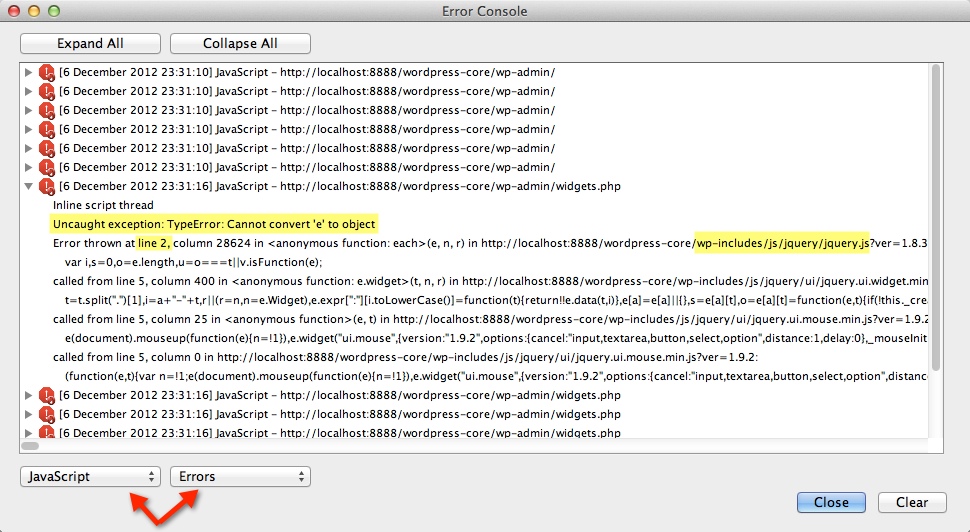
Step 2: Identify the Error
The error console will open. Select JavaScript and Errors from the two dropdowns. To find the error location, expand one of the errors. You'll see the error and the location.
Bug Reporting to Development Team
Now that you have diagnosed your error, you should make your support request.
Please include the below information:
- Browsers that you are experiencing the problem in.
- JavaScript error - screenshot of the console window.
- Location of the error - both the file name and the line number.
- Context of the error - including the whole error stack will help developers.
