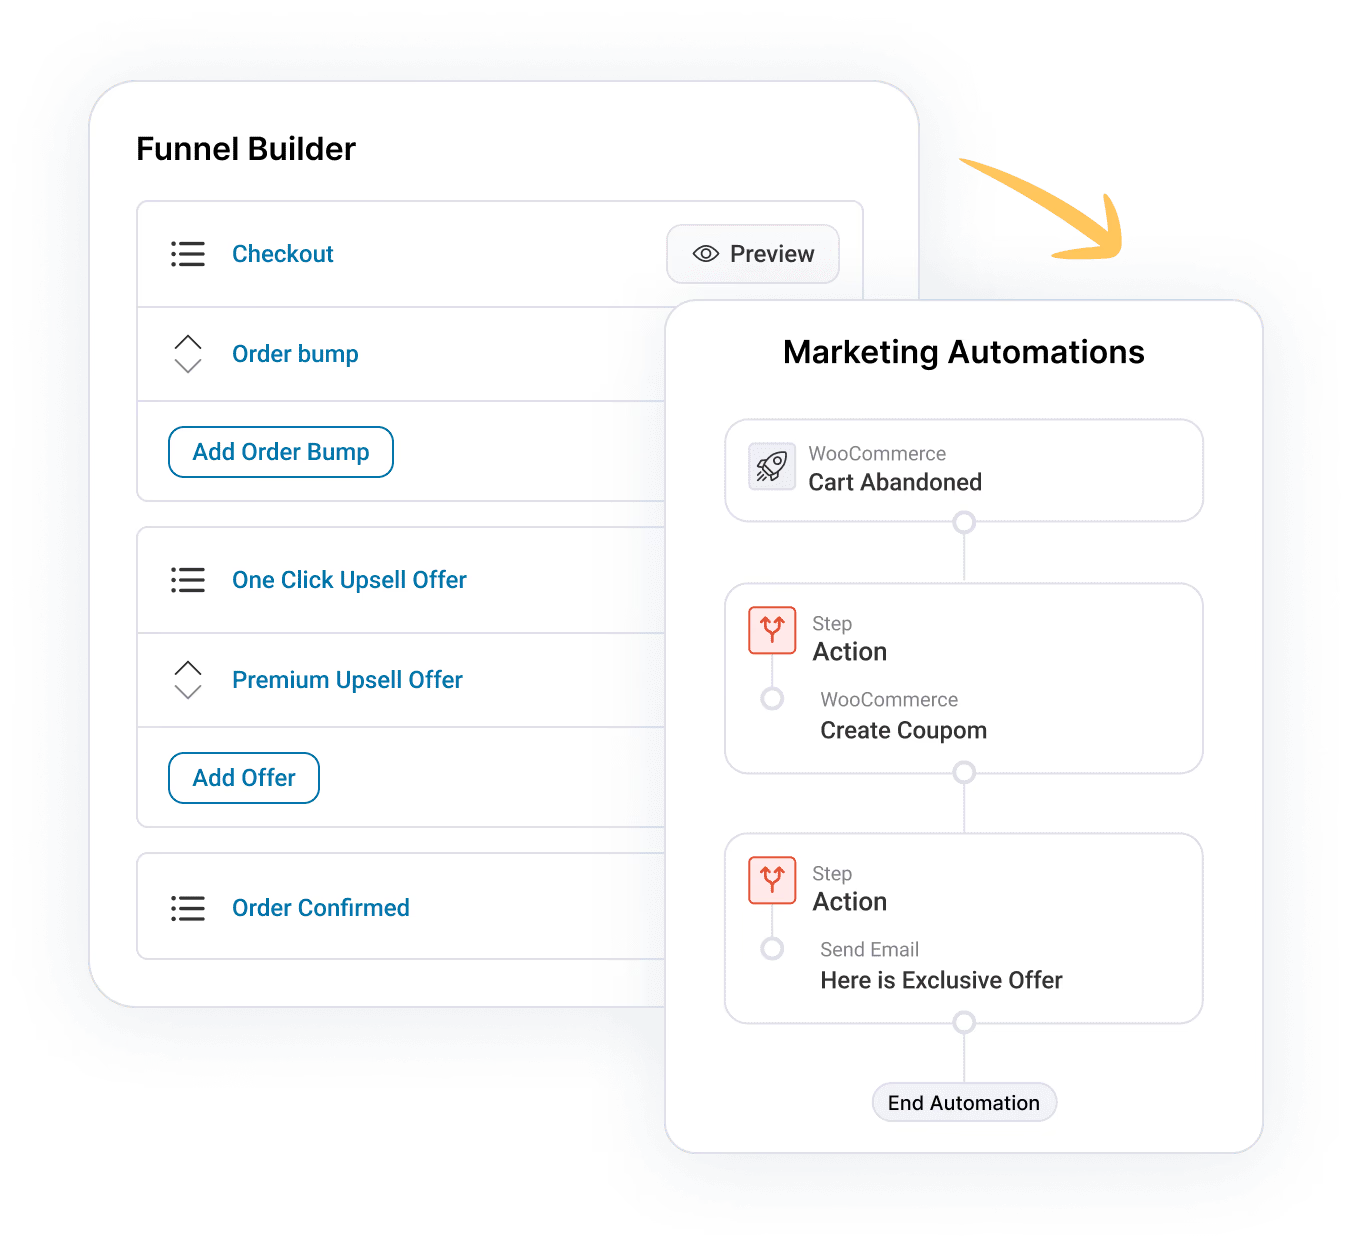
The next-gen automation builder has the Analytics section to view the performance metrics of respective automations.
You get four tabs of Contacts, Emails, SMS and Split Path to analyze the performance of your workflow.
Contacts
View all the metrics related to contacts collected in the specific automation.
This tab has a quick view of:
- Active Contacts
- Completed Contacts
- Orders
- Revenue
- AOV
- Unsubscribes
Select the date range and you'll see the metrics of your automation:
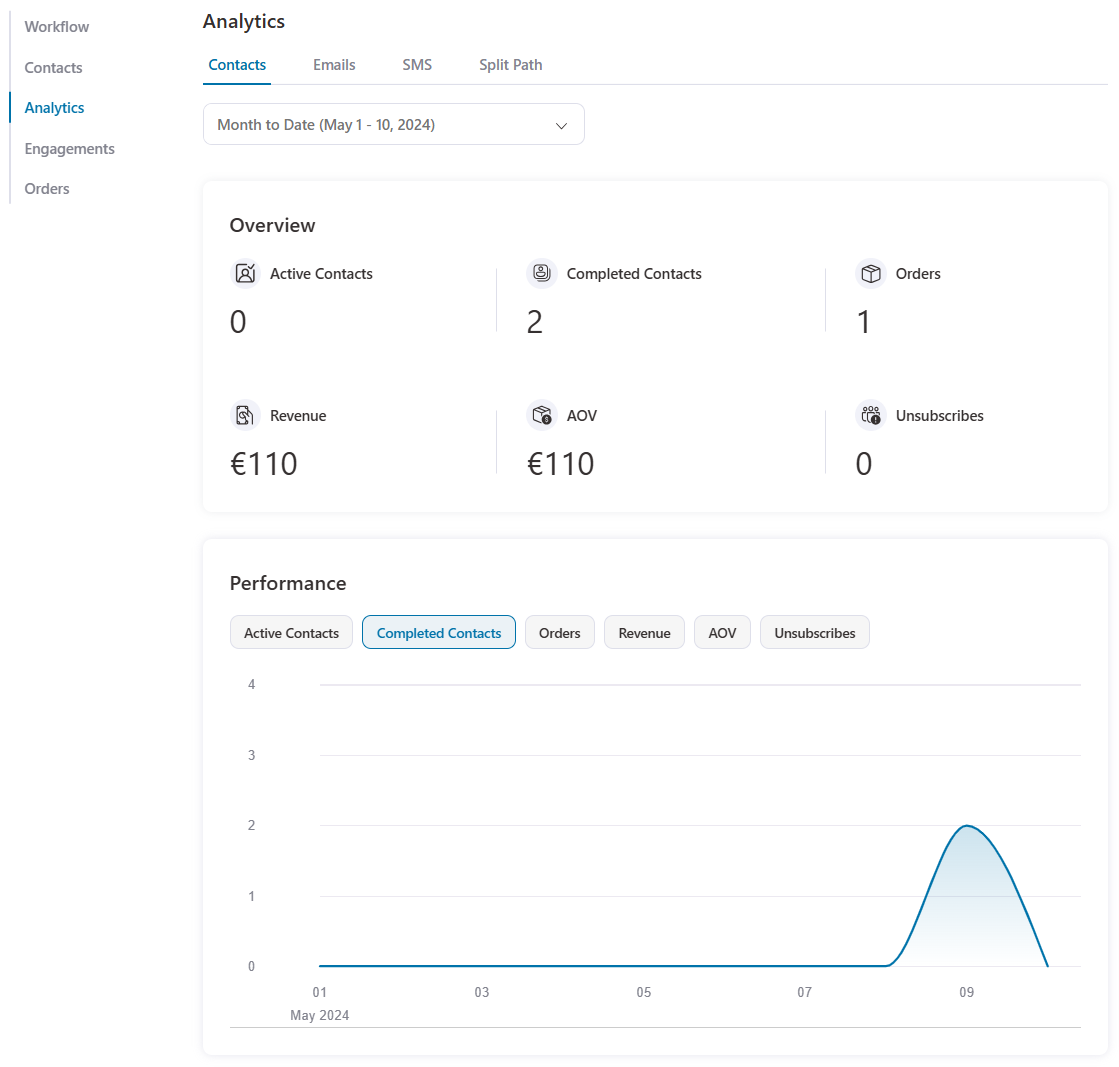
You can also view this information plotted on a graph or chart.
Emails
Analyze the performance of how your emails are performing within the specific automation.
See all your stats, such as sent emails, open rate, click rate, orders placed, and revenue generated.
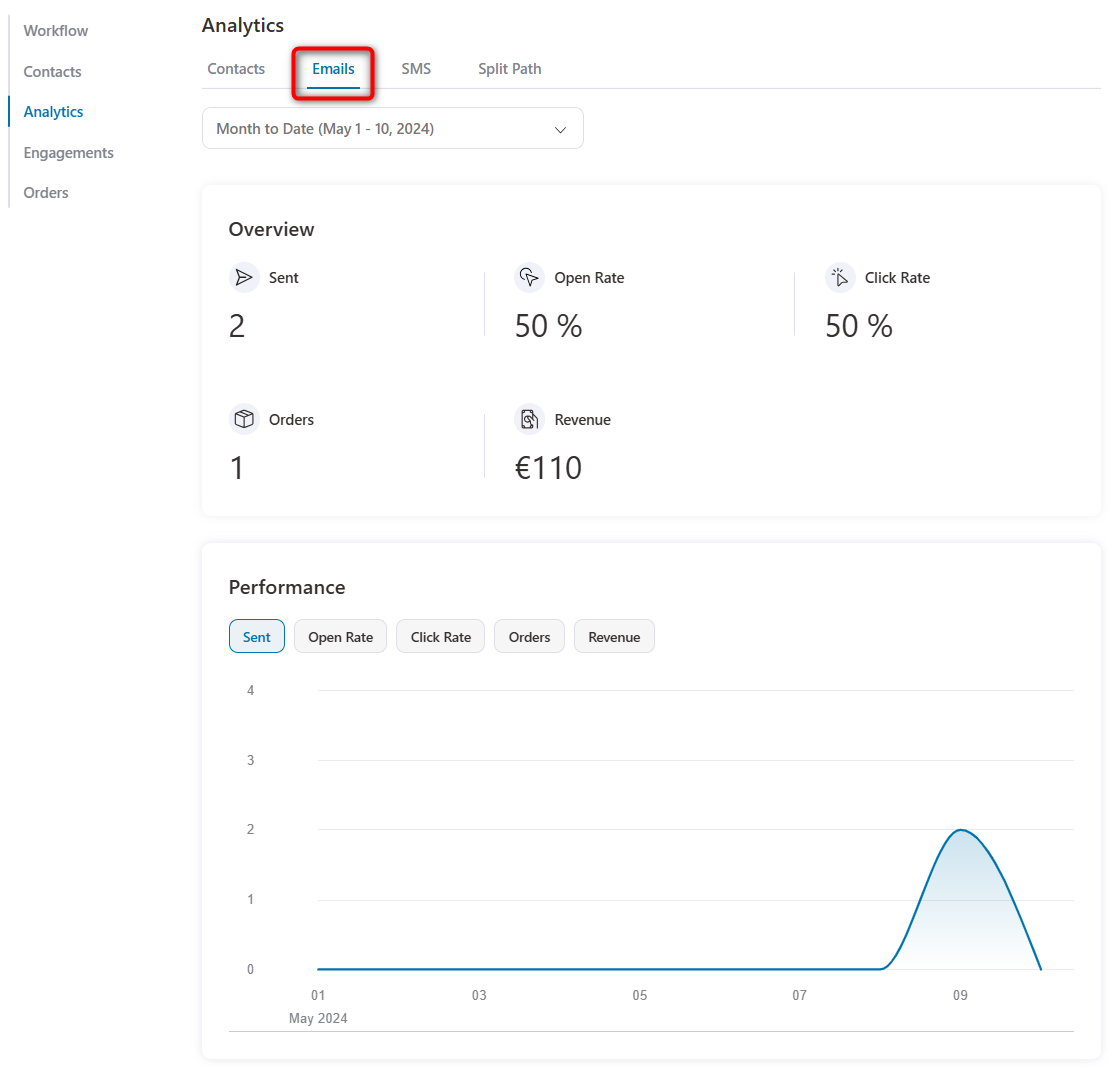
Select a date range and view all this information plotted on a graph.
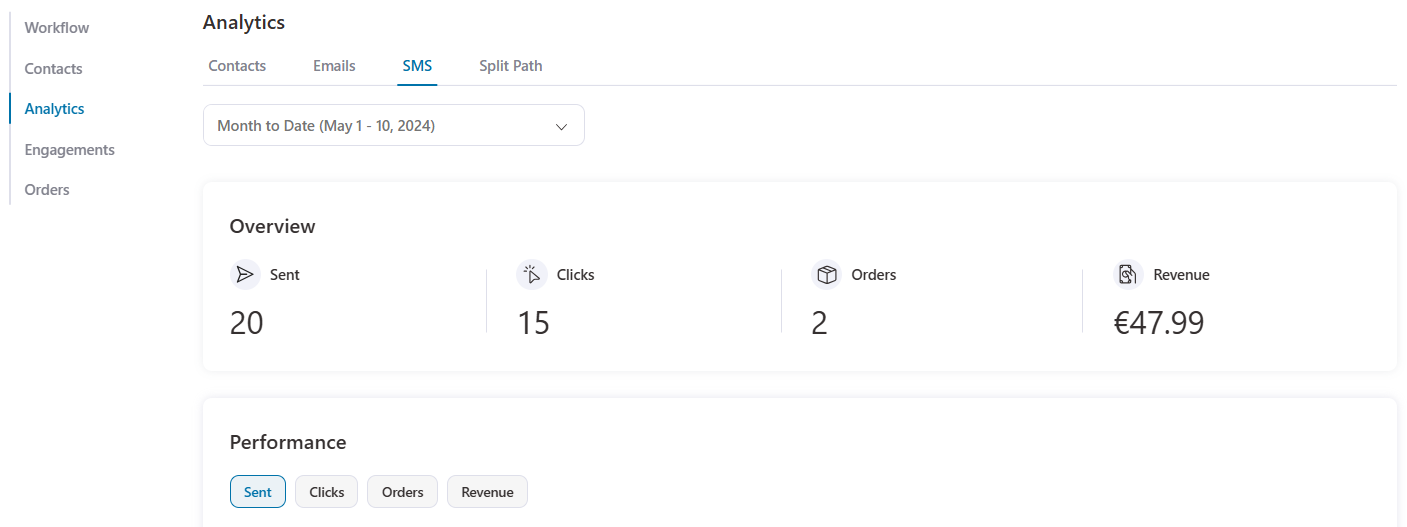
SMS
See the metrics related to the SMS you've sent to your contacts via automation.
You'll be able to see the total SMS sent, number of clicks, orders placed and revenue generated in the campaign.
Split Path
See the analytics related to split path testing.
Scroll down and you'll be able to see all the metrics plotted on a graph.
That’s it! This is all about the Analytics section in an automation.