For each email broadcast, you’ll be able to view real-time analytics to see how your broadcasts are performing.
Analytics in FunnelKit Automations isn’t just about measuring the open and click-through rates. Instead, you can view conversions, orders placed, and revenue made from each broadcast.
There are two tabs to analyze your broadcasts:
Let’s go through each metric tab one by one.
Email Analytics
See the overall performance of your emails.
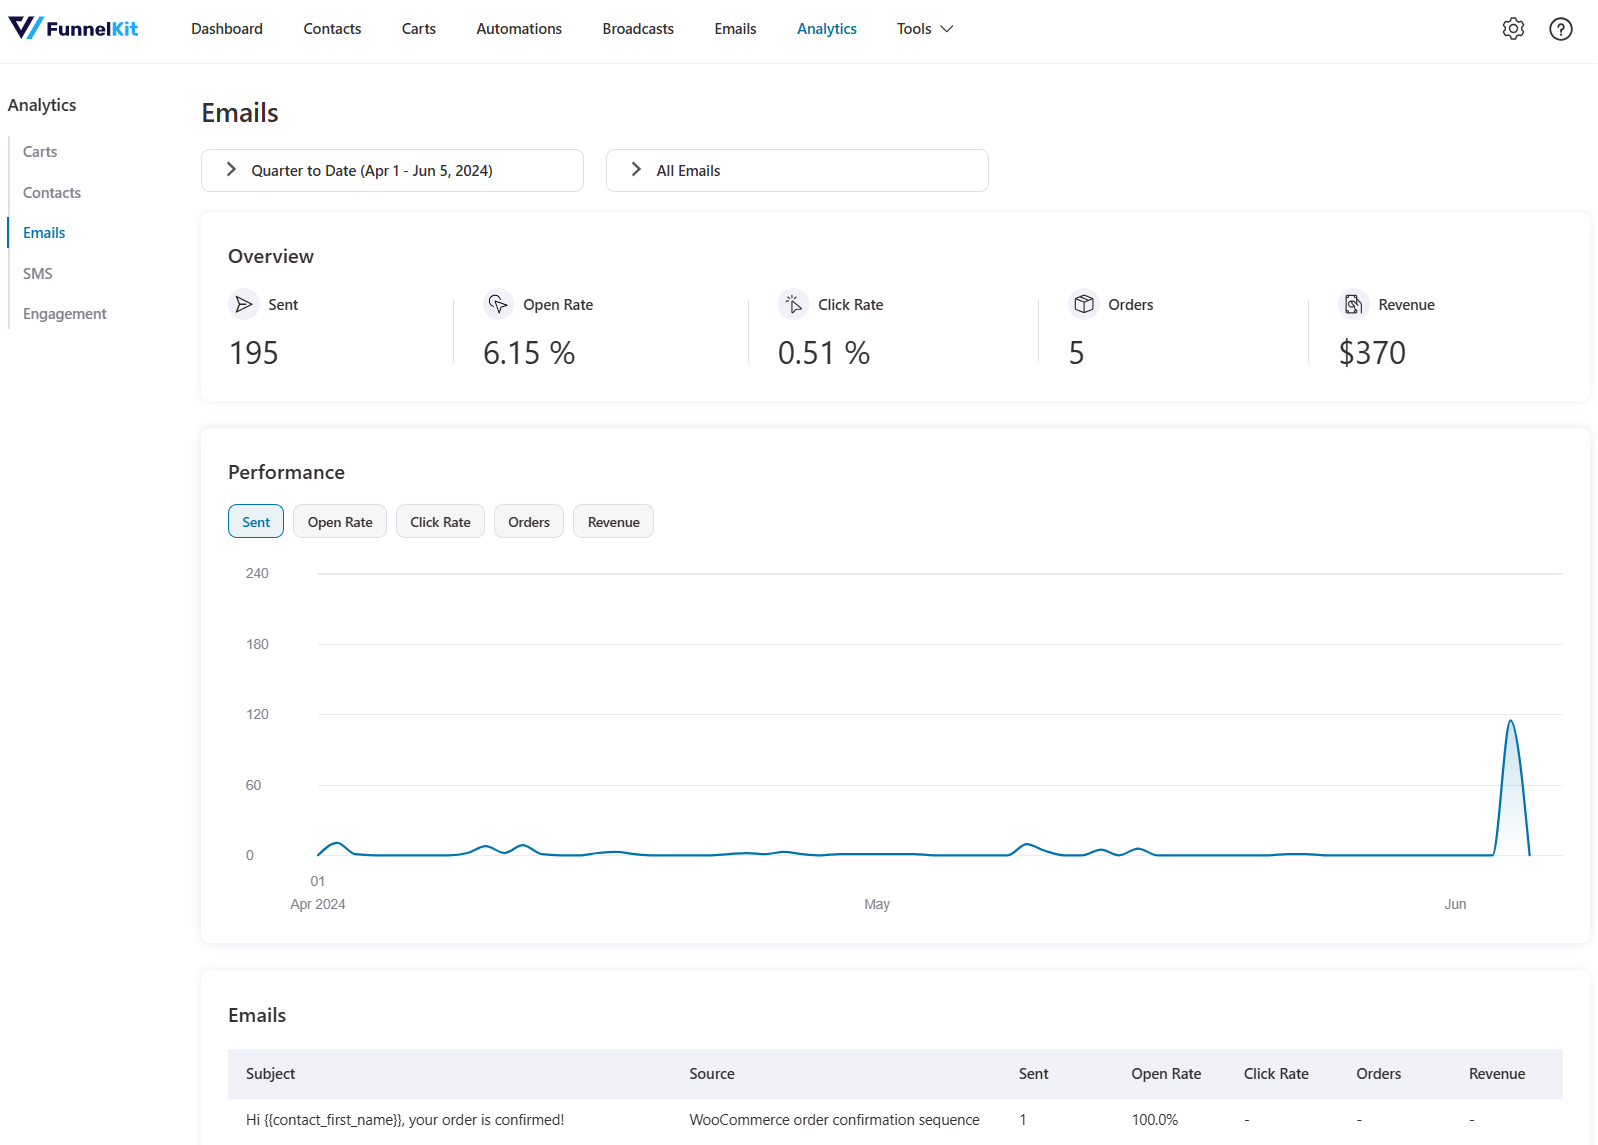
You can view the metrics here:
- Sent - Number of contacts you sent your email broadcast to
- Open rate - Open rate of your email broadcast
- Click rate - Click-through rate
- Orders - Number of orders placed via email broadcast
- Revenue - Revenue made from your broadcast
- Unsubscribe - Number of contacts unsubscribed
You can view the details of your email broadcasts by visualizing them in a graphical format through a line chart or bar graph.
You can even filter the email analytics for single broadcast or automation.
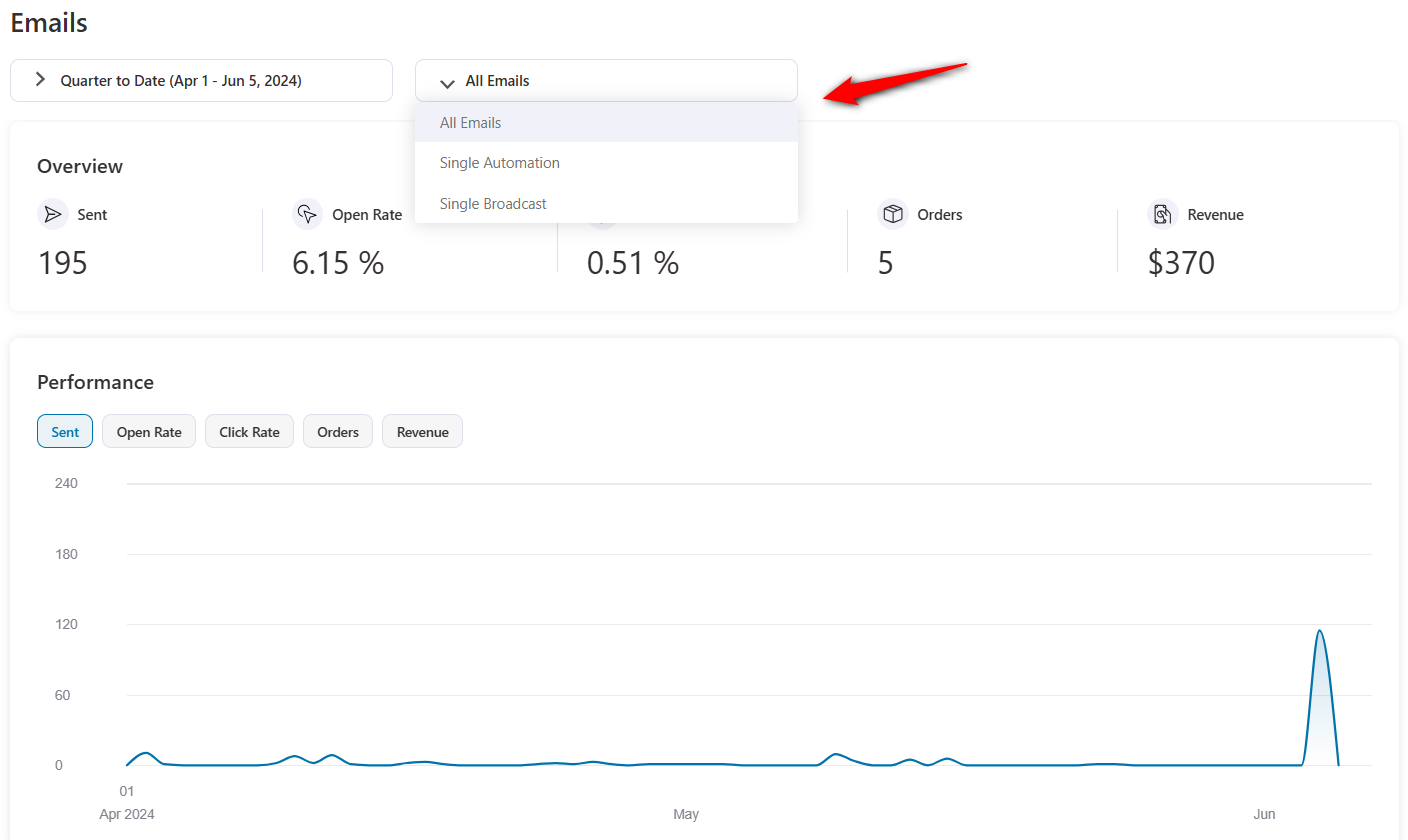
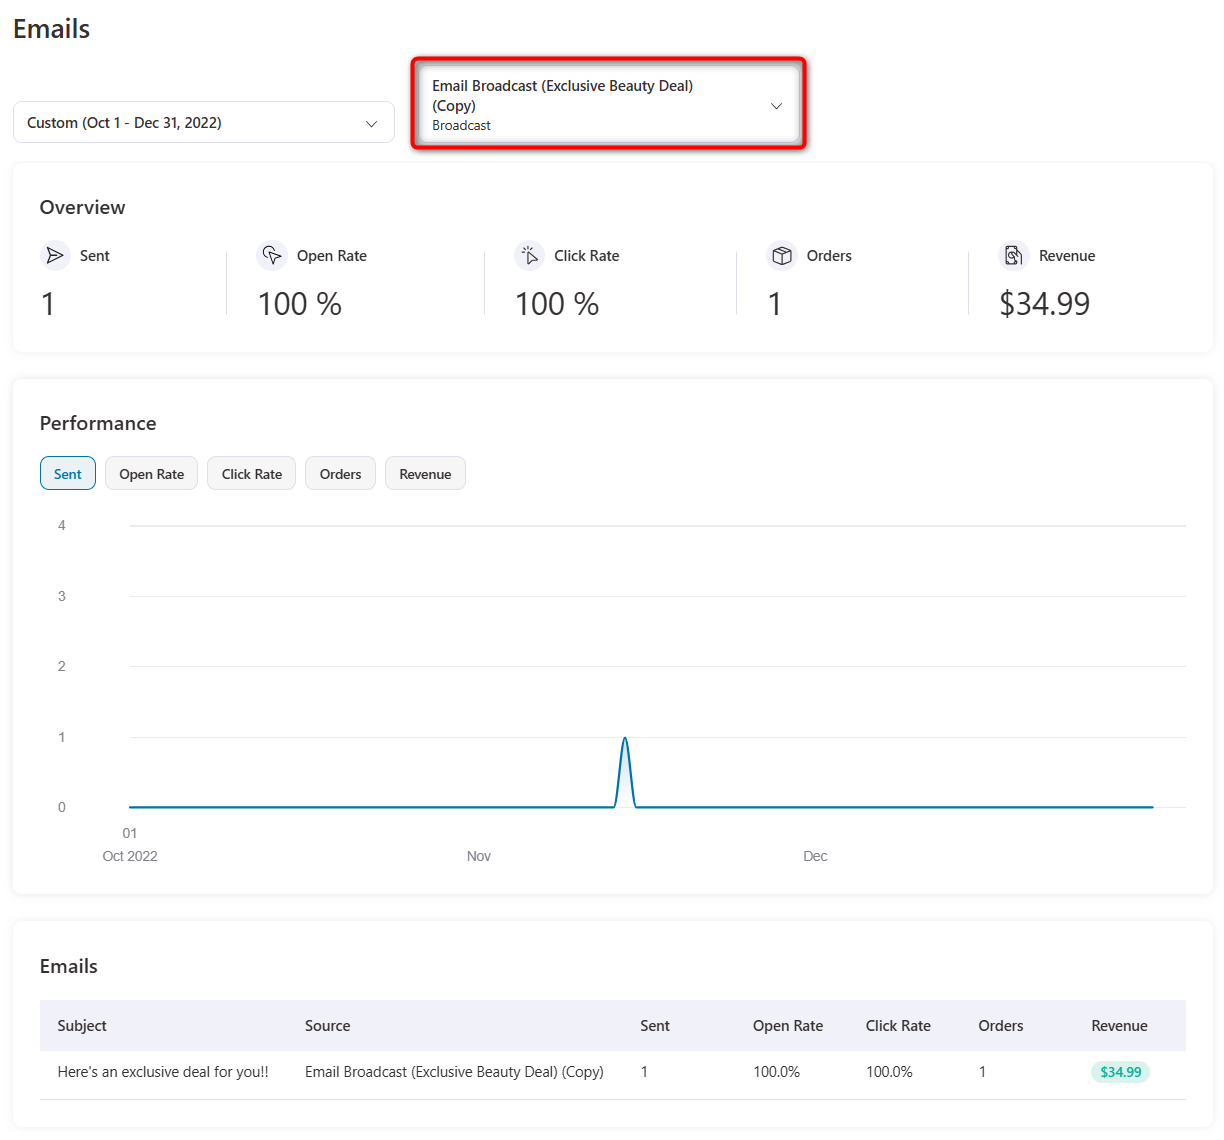
Select a specific broadcast for which you want to see the stats:
Engagement
You can see the engagement of each contact with the email broadcast you sent.
It helps you track your contacts’ engagement by day and hour.
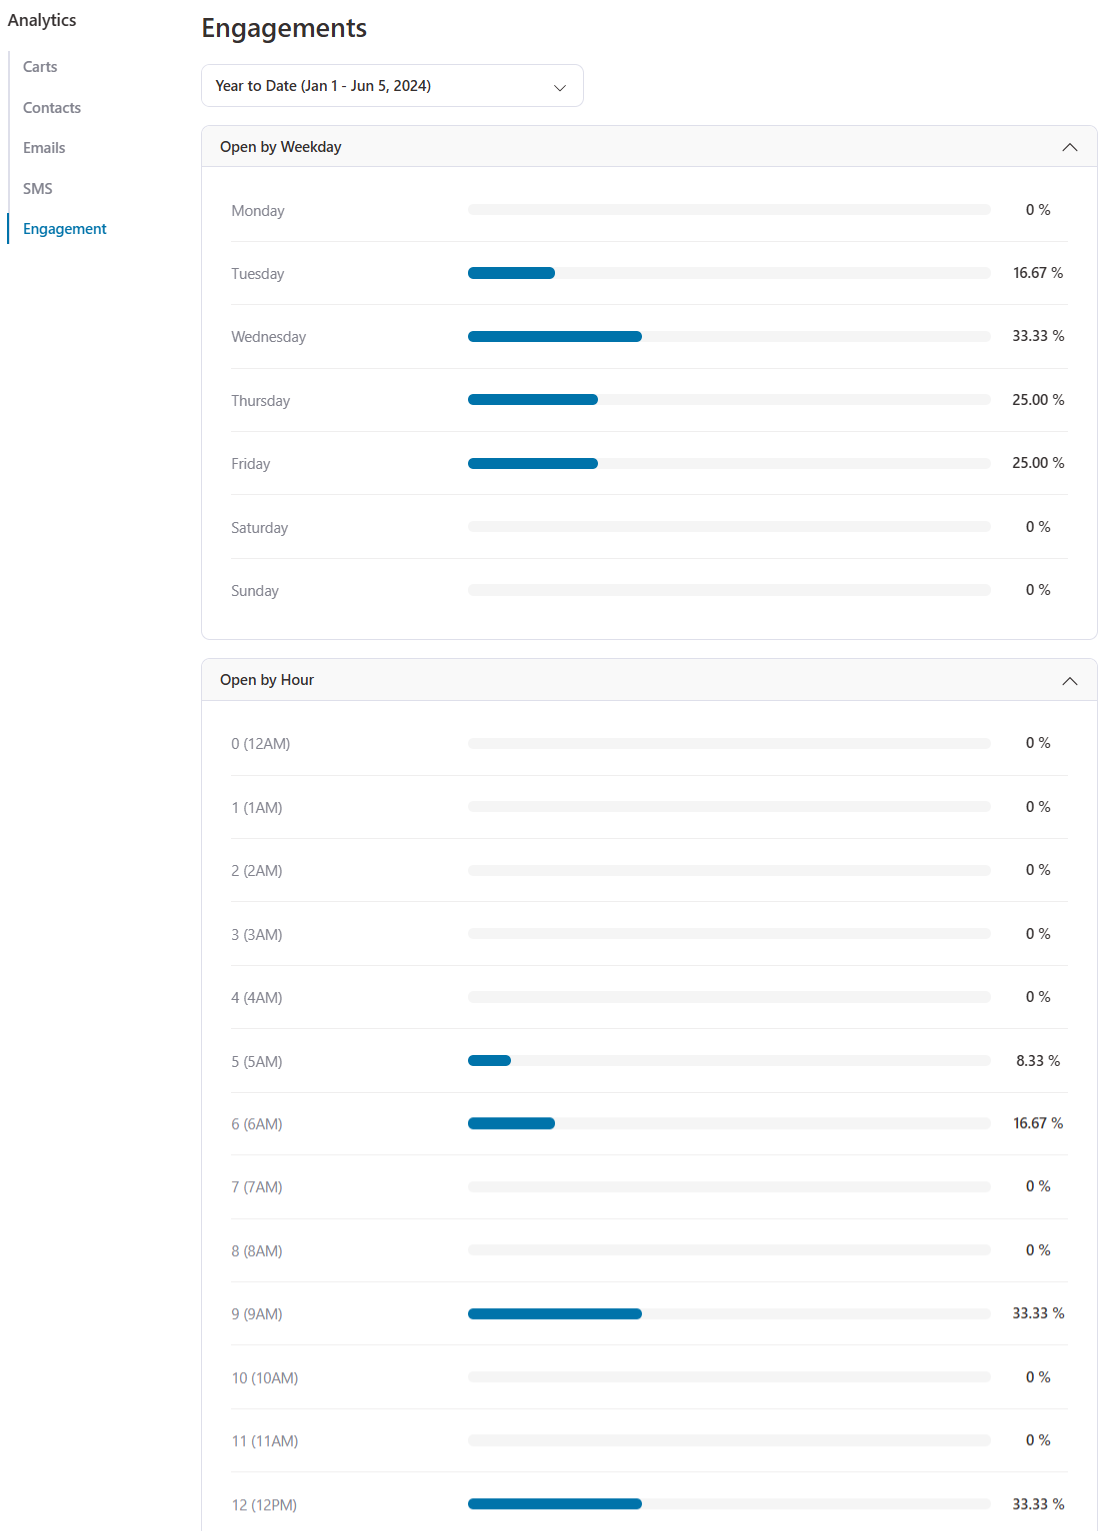
This will help you analyze which day and time is best to send emails to your contacts.
That’s it! This is how you can measure the performance of your email broadcast campaigns.