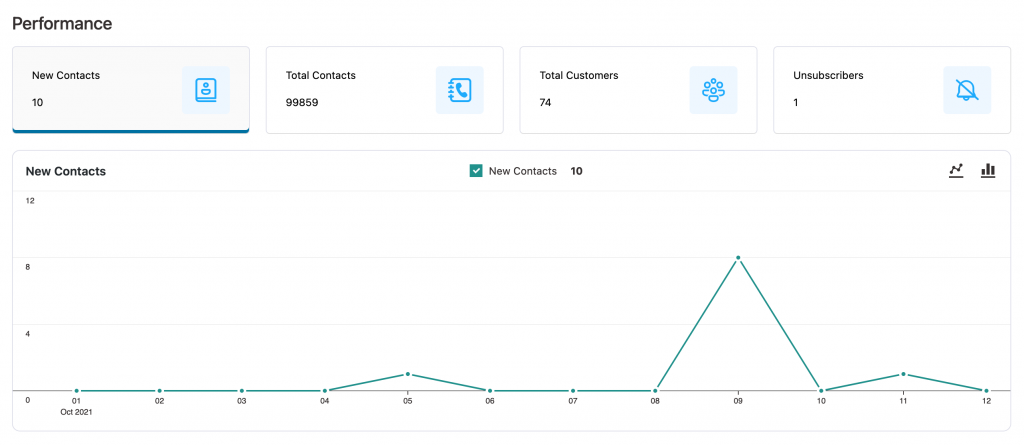
Here, you can see the data related to your contacts.
You can select a date range to see how many new contacts are added, the total number of contacts, contacts who got converted to customers, unsubscribers, and more.
To study all these numbers, go to Analytics → Contacts

Along with the date range, you’ll see the following two sections:
Performance
Here, you’ll be able to see the number of:
- New Contacts
- Total Contacts
- Total Customers
- Unsubscribers
Next to it is the graphical representation of the tab you selected. For example, if we have selected New Contacts, then we will see the graphical view of fresh contacts as per the date range.

This is all about the contact analytics in FunnelKit Automations.


